

The REIT/BASE D-Score®

Introduction to Dividend Scoring
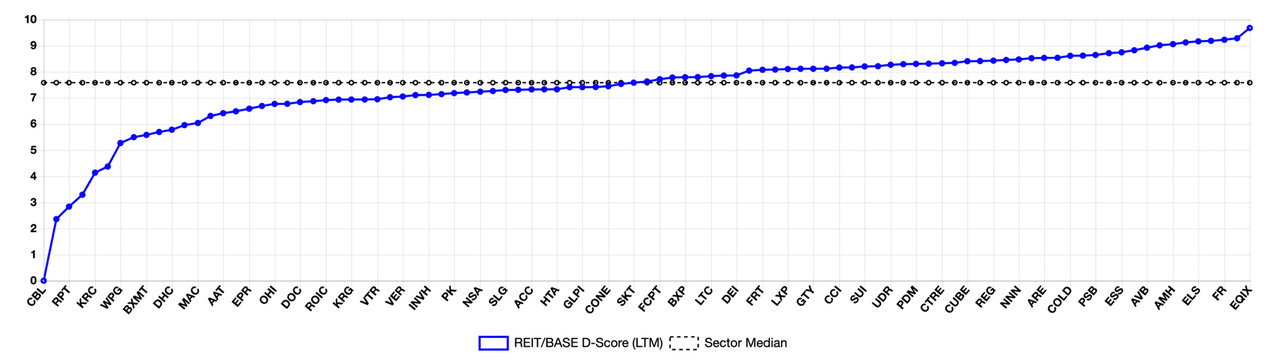
As an adjunct to its financial data service, REIT/BASE has created a proprietary dividend scoring model called D-Score®. Using a familiar 1-10 rating scale, the D-Score® model measures relative payment risk across a large universe of public REITs. The following graph provides a summary of dividend risk scores for each of the 97 REITs covered by REIT/BASE.
Scoring Methodology
The REIT/BASE D-Score® is a summation of eight risk factors that influence dividend safety. These sub-components are then weighted and combined to form a composite dividend score. A description of each risk factor is as follows:
- Property Type – Dividend safety begins with the stability of property NOI. The importance of property type cannot be overstated as there is a high correlation between property type and dividend risk. In 2020, regional malls, shopping centers, and hotels suffered dividend cuts and suspensions virtually across the board. In other sectors, dividend risk was idiosyncratic based on exposure to movie theaters, tourist income, or senior housing.
- Tenant quality – The D-Score® model assigns a separate risk score to tenant quality, which augments the basic property score. In retail for instance, the risk of tenant bankruptcy in Class-A malls is greater than the risk assigned to the mall itself. In other categories such as multifamily and storage, tenant risk is synonymous with the property type.
- Leverage – REITs with too much leverage are vulnerable to earnings dilution if leverage needs to be brought down. Our leverage risk factor is based on Net Debt/EBITDA, which is the metric most-often used by investors and analysts. While 6-7x leverage used to be thought reasonable, stronger REITs are now operating closer to 5x.
- Coverage Ratios – Fixed charge coverage (FCC) is another take on financial leverage. Similar to the rating agencies, we calculate FCC net of recurring capital expenditures and non-cash revenues, and include capitalized interest as part of fixed charges. This provides a more conservative coverage measure versus simple EBITDA/Interest ratios. Relative to yesteryear’s benchmark ratio of 2.5x, in today’s interest rate environment median coverage ratios are now 3-4x and climbing.
- AFFO Payout – We view AFFO/share as the primary driver of dividend coverage and place zero weight on FFO-based metrics. Adjustments for non-cash revenues, recurring capital expenditures, and various one-time items all need to be considered when measuring dividend capacity.
- Taxable Income – REITs provide investors with important tax information each January. We pay particular attention to levels of ordinary income versus capital gains or non-earned distributions. Dividend composition provides insight into what REITs have to pay and what they are paying.
- Dividend Yield – The D-Score® model also makes use of dividend yield based on each quarter’s closing stock price. Importantly, changes in dividend yield provide a forward view on risk, which complements the use of historical financial ratios.
- Preferred Stock – Use of preferred stock in capital structures creates additional financial leverage and effective subordination of common stock dividends. When preferred stock is employed, D-Scores are adjusted downward based on the overall weighting of preferred stock to total equity capital.
LTM vs. Spot Analysis
Financial ratios used in D-Score® analysis are calculated on a trailing 12-month basis (LTM), which helps smooth out quarterly fluctuation in earnings and leverage metrics. But we also calculate D-Scores using current quarter financials. This provides an alternative (or ‘Spot’) way of viewing risk scores, with the keen investor keeping a sharp eye out for any divergence. In particular, when D-Score Spot values start to move lower from LTM scores, that can be an early-warning sign of trouble ahead or at least cause for further analysis.